03 / Signals
Signals
in the open.
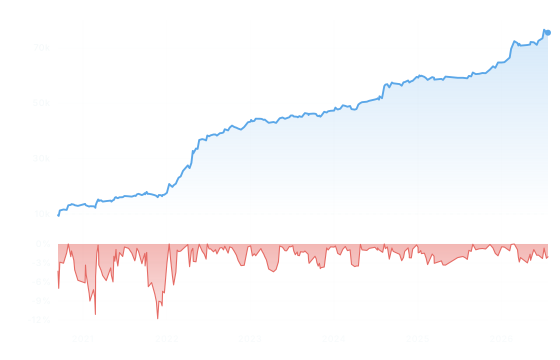
Every Nasdaq Trader signal is taken at a defined level, with a defined stop, and published as it happens. The same signals are mirrored into an NQ option spread — two long calls (or puts) 25 points out of the money, and once the trade runs 50 points in our favour, one short option 200 points further out, exiting with the futures signal. The chart uses the same method as our Constant2 record — average annual return, drawdown measured from the running peak — on an identical 30,000 basis, with 1% slippage per transaction and 1.50 per contract in commission included. The grey line is the live executed Nasdaq Trader futures record, the blue line is the option model applied to those same signals. The futures record is real; the option line is modelled, not executed.
See the futures track record →