📊 Nasdaq Trader → NQ Options
Real Nasdaq Trader signals (C2, MNQ) mirrored 1:1 into NQ options · Starting capital $25,000 · 741 trades · Generated 12-08-2026 15:10 UTC
1 option per signalIV 18%
1DTEATM
Start $25,000
Approach: every real Nasdaq Trader trade (LONG → call, SHORT → put) priced on NQ with Black-Scholes (r 4.5%, no dividend), fixed 1 option per signal, $2.00/contract round-trip costs. No compounding.
📈 Equity curve + drawdown
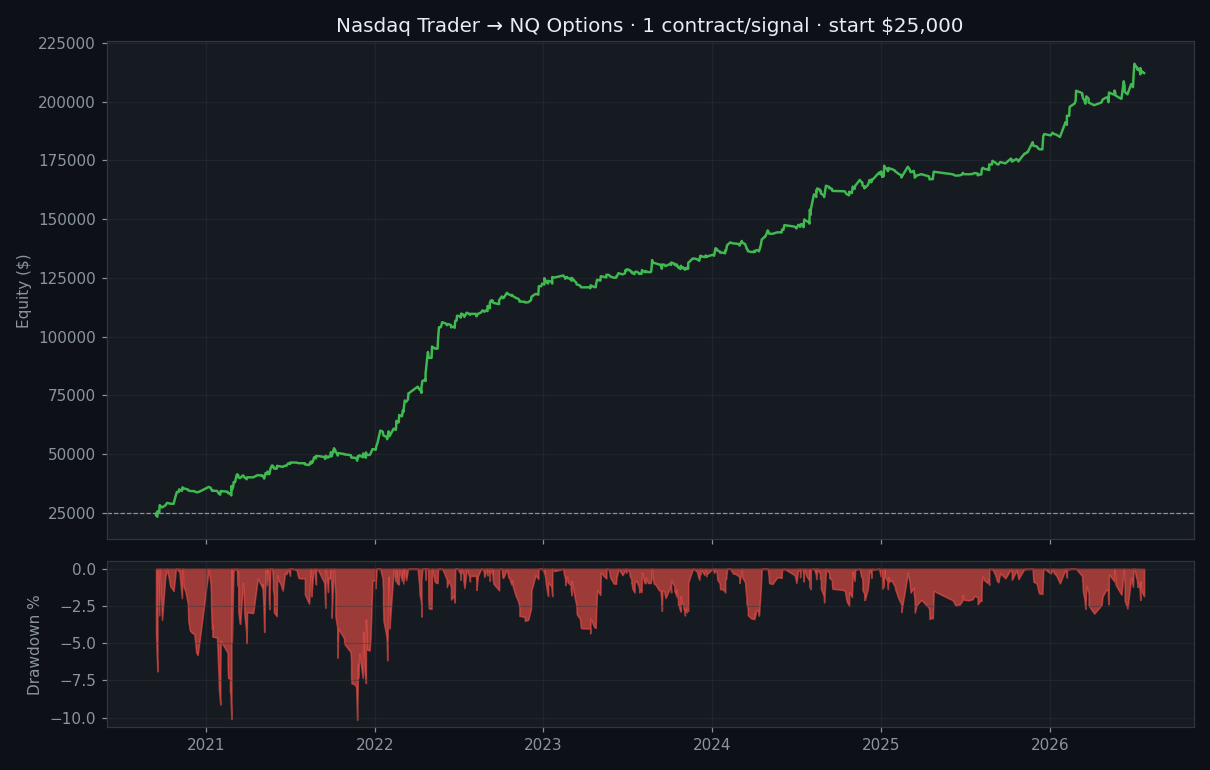
Period Sep 2020 → Jul 2026 · fixed 1 option per signal · equity = start + cumulative P&L (no reinvestment).
📅 Return per year
Return = P&L of that year ÷ equity at start of year. Equity grows linearly with fixed 1 option per trade (no compounding).
⚖️ Comparison: NQ Futures vs NQ Options
Both with fixed 1 contract per signal, $25,000 start, costs included (NQ future $5/contract, options $2/contract round-trip).
⚠️ Important to know
- Backtest uses Black-Scholes with fixed IV 18% — real option prices fluctuate (IV, bid/ask). Results are an approximation.
- NQ options are heavy: 1 ATM 1DTE contract costs on average $2,359 (median $1,991) — with $10,000 that is 24% of your capital per trade. That is why the minimum here is $25,000.
- Options have theta decay and pin risk: on a sideways day you lose time value even if the direction is right.
- Losing streak: maximum 12 losses in a row. Worst trade −$2,221 (-9% of starting capital). The max drawdown of −10.1% is the real risk measure.
- This is a backtest, not a guarantee of future results. Losses can exceed what the backtest shows.
